Real-time equity block flow
Every block trade, dark pool print, and sweep — surfaced the moment it hits the tape, across every stock and ETF. When serious capital moves, ThickPrints shows you where. Not after the move. Not in a recap. Live.
No card required · Cancel anytime · $49.99/mo after trial
What you see
Thousands of tickers move every day, and most of it is noise. What matters are the moments when unusually large trades appear — real capital entering the market. ThickPrints surfaces three kinds of marks, instantly.
Single trades too large to hide, hitting lit exchanges. They cluster in the names traders end up focusing on later in the session.
Institutional-size trades executed off-exchange, reported to the tape. The price levels where they cluster often act as reference points for weeks.
Orders cutting through multiple venues at once — someone wanting in or out fast, at size, without waiting for a better price.
A session with ThickPrints
ThickPrints isn't a signal service — it's how you watch the market all day. Here's what a session actually looks like.
09:42 ET
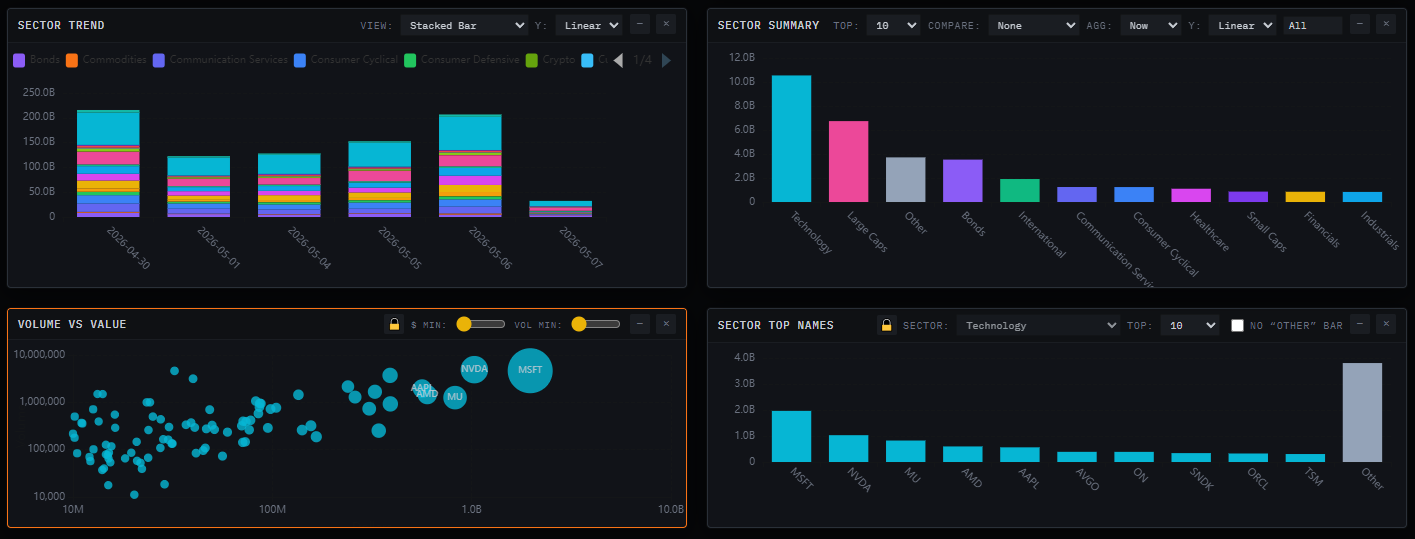
The Sector Flow view breaks down total block flow by sector in real time, then lets you drill into the top names driving it, ranked by notional. When large prints start stacking in one group before 10am, that's usually where the session's energy goes. You know where to look — before individual names start moving.
10:47 ET
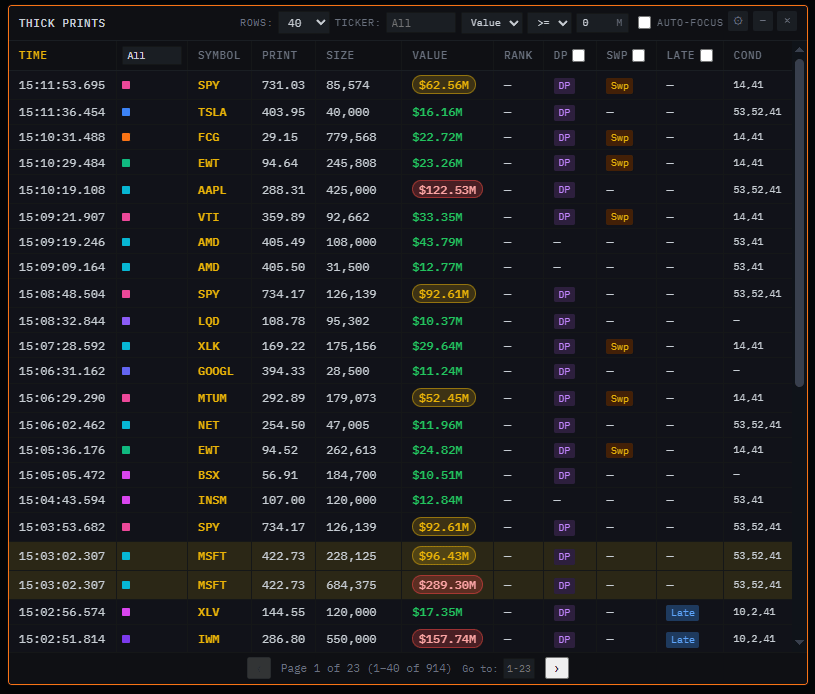
The Thick Prints feed streams every unusually large trade across the market, filterable by size, type, and sector. Set sound or visual alerts on your names and stop staring at the tape — ThickPrints tells you when something worth looking at appears. No unusual activity in a name you're itching to trade? That's information too.
13:12 ET
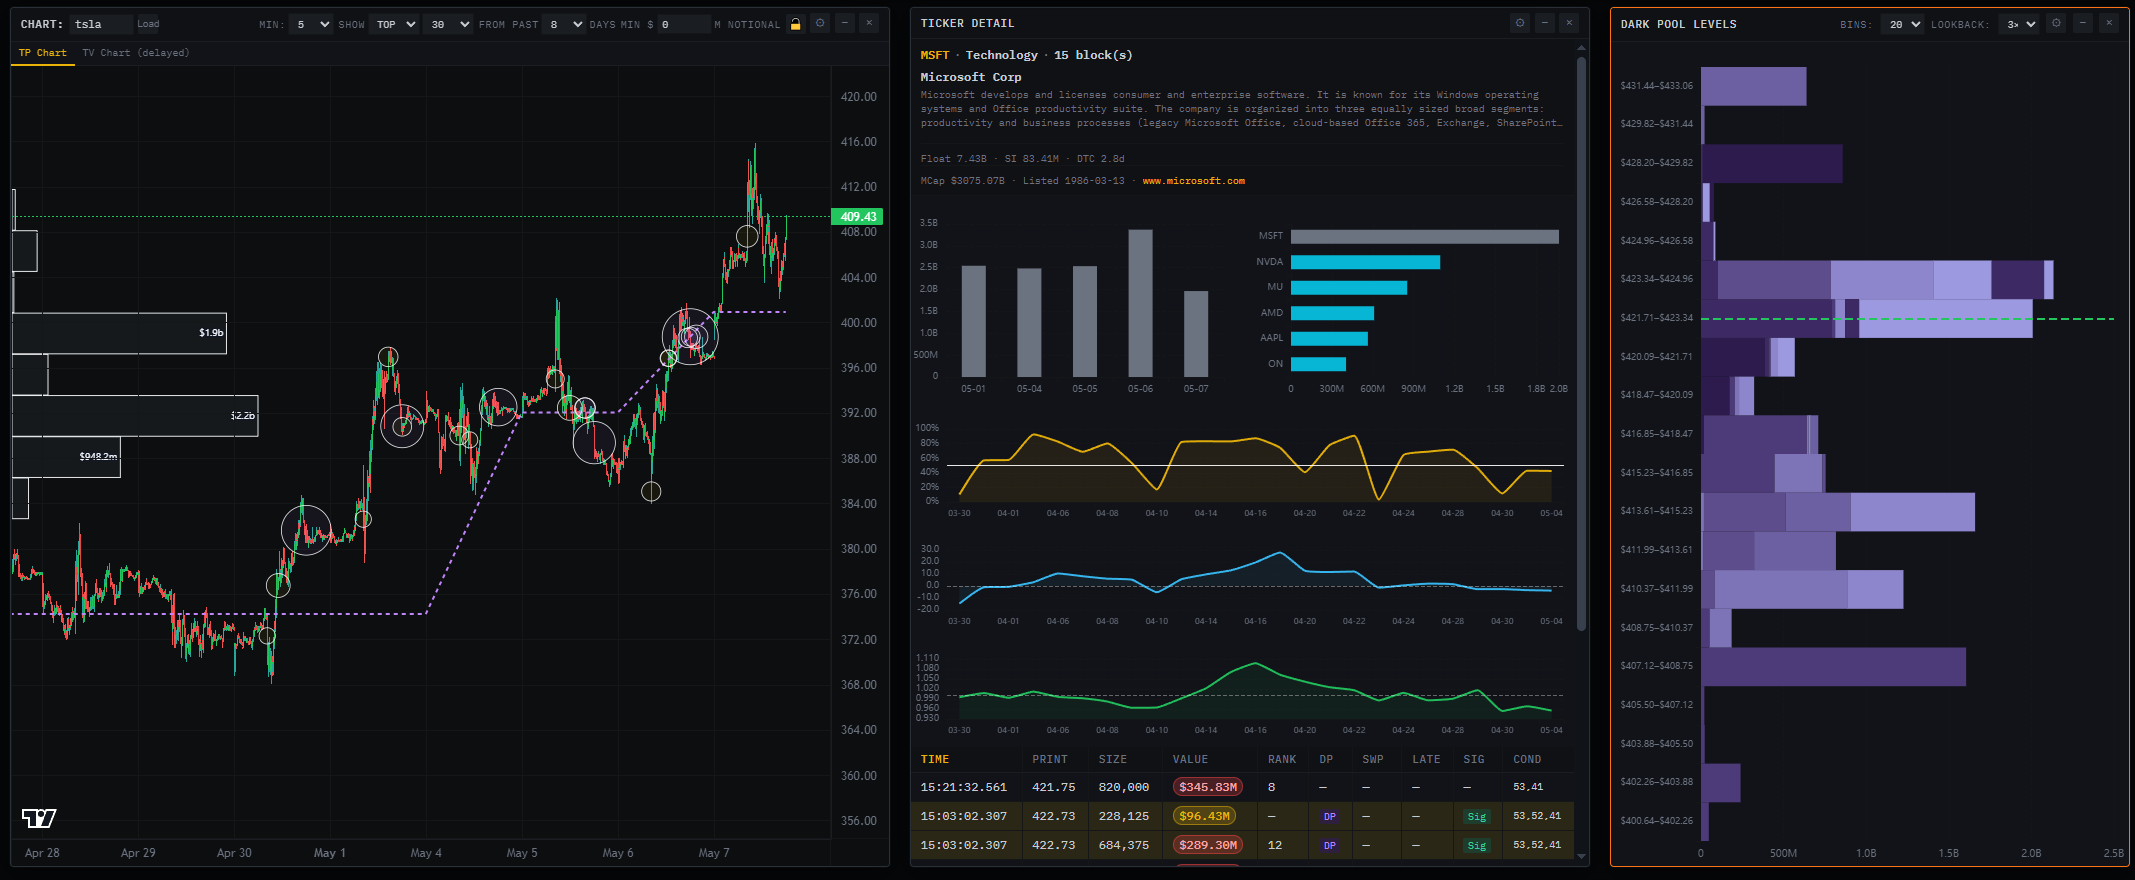
For any ticker, see the exact prices where significant prints have clustered over time — dark pool and lit blocks — overlaid on the chart. When price comes back to test a level where $80M transacted off-exchange six weeks ago, you'll know it's there. Context that price action alone can't give you.
16:05 ET
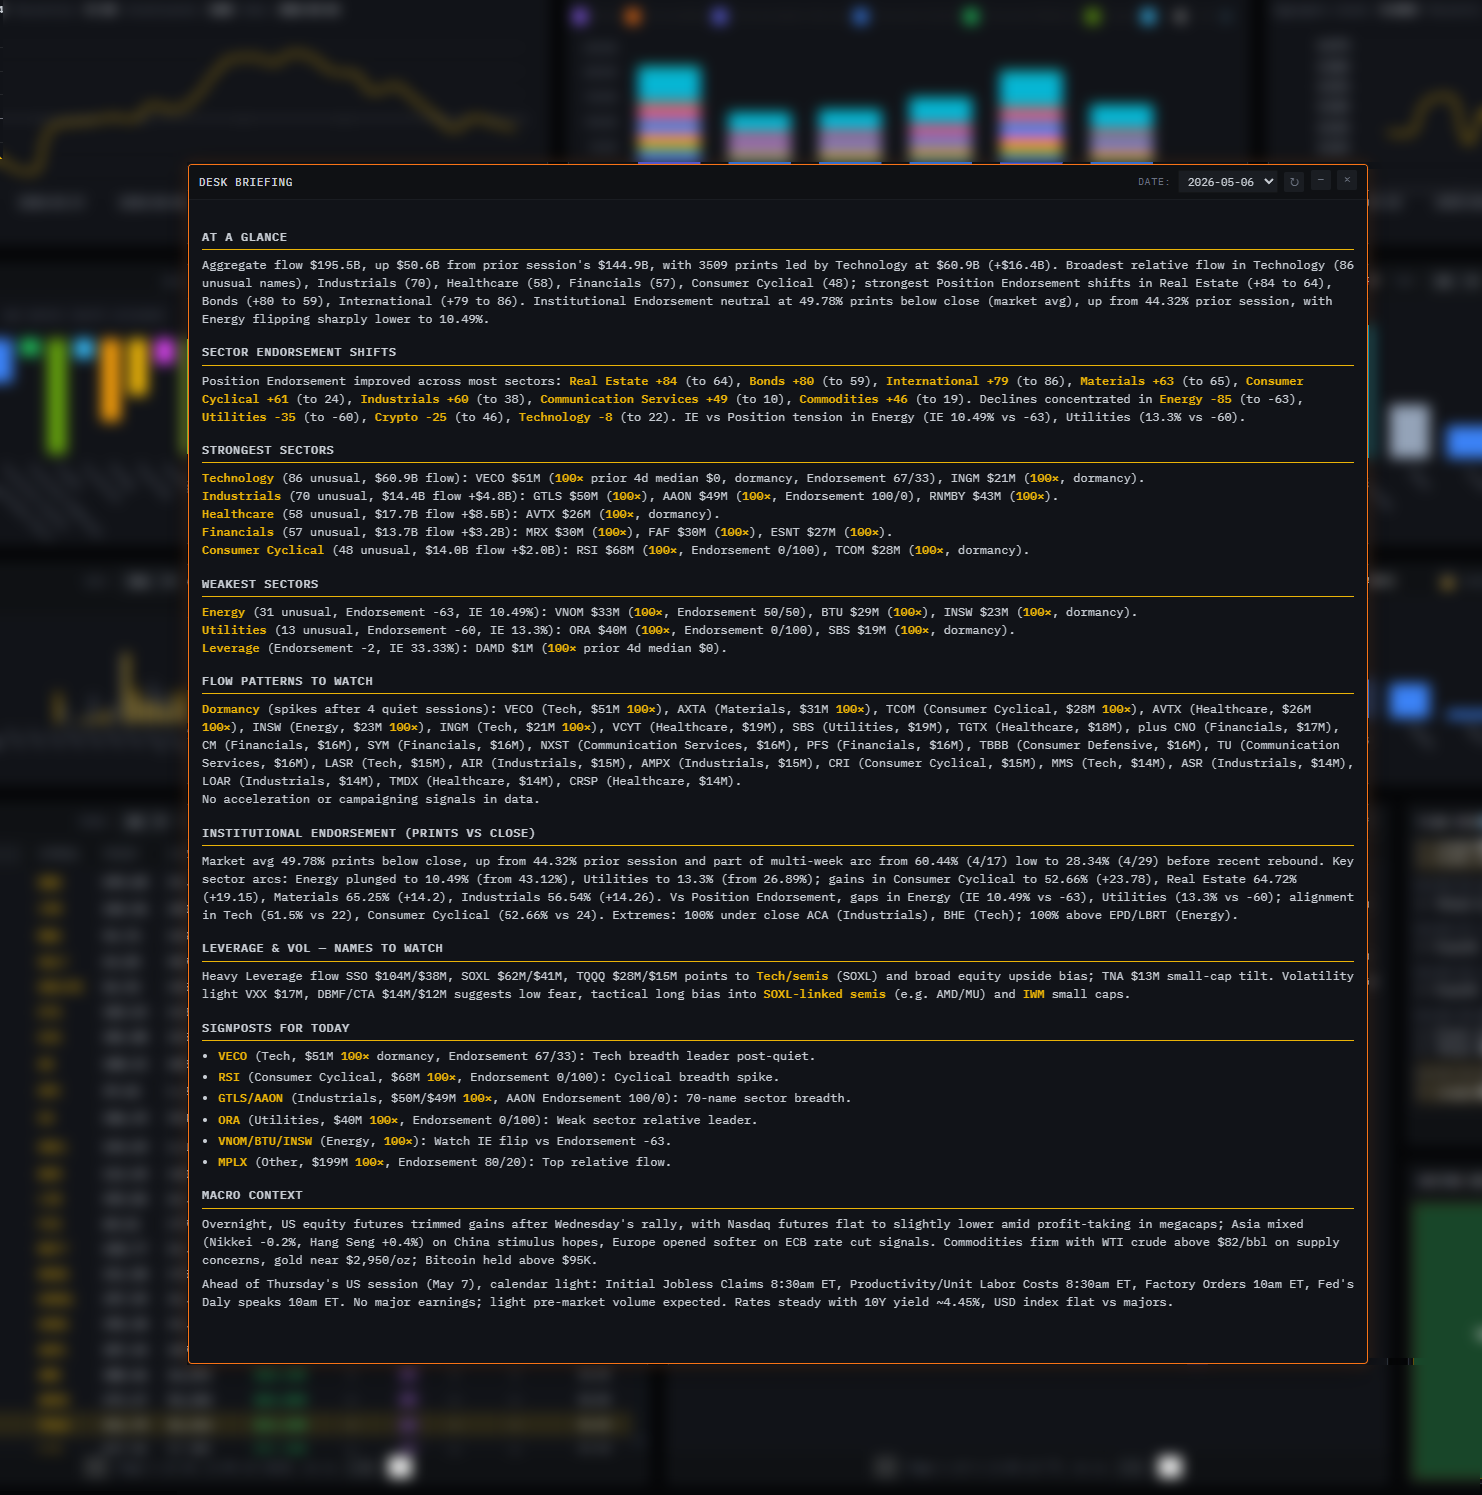
After the close, the Desk Briefing synthesizes the day's block flow into a written recap — top prints, notable clusters, sector themes, unusual patterns. What the tape did versus what the headlines said. Those two things disagree more often than you'd think.
That's four windows out of 25+ in a fully customizable workspace — volume profile, sector heatmaps, breadth gauges, quote monitors, flow analysis, and more. Drag, resize, snap, build your own desk.
Explore the full toolkit →How we're different
Every other platform in this space was designed around options flow. ThickPrints was built from the ground up for traders watching stocks and ETFs — where the real block activity lives.
| Unusual Whales | Flowalgo | ThickPrints | |
|---|---|---|---|
| Primary audience | Options traders | Options traders | Stock & ETF traders |
| Dark pool timing | Limited | Hours–next day delay | Real-time |
| Sector-level block flow | No | No | Yes |
| Customizable dashboard | No | No | Yes — 25+ windows |
| Daily tape briefing | No | Snapshot recaps | Full desk briefing |
| Monthly price | ~$50 | $149 | $49.99 |
| Free trial | No | 2 weeks / $37 | 7 days, no card |
Competitor details as of July 2026, based on public pricing pages. Both are solid tools — for options traders.
From our users
I don't use it to predict anything. I use it to stay disciplined. When I'm itching to take a trade and there's no unusual block activity in that name, I pass. That filter alone has cut my bad entries in half.
I want to be honest: I don't think block flow is alpha by itself. What it is, for me, is a noise filter. It tells me which names have real participation and which are just moving on air. That's worth $50 a month even if it never tells me a single direction.
I only have about 30 minutes in the morning before work. I check the sector flow, scan the prints from the last hour, set my watchlist alerts, and I'm done. It's the most information-dense 30 minutes of my day.
Pricing
No tiers, no add-ons, no "pro" upsell. Every window, every feed, every briefing — real-time from day one. Early subscribers keep founding pricing for life, even as we add features.
Questions
No — and that's the point. ThickPrints tracks equity block trades, dark pool prints, and sweeps in stocks and ETFs. If you trade shares, this is flow in the instruments you actually trade, not derivatives activity you have to translate.
Inside the platform, yes — prints appear the moment they're reported to the tape. The sample tape on this page is 15-minute delayed, as exchange rules require for public display.
No. Create an account and you get 7 days of full access — every window, real-time data, the works. You only enter payment details if you decide to stay.
No. ThickPrints doesn't give signals or recommendations, and nothing on this platform is financial advice. It shows you where unusually large trades are happening so you can build your own read of the market. Many of our users say the most valuable thing it does is tell them when not to trade.
Yes — one click from your account page, no emails, no retention calls. If you cancel, you keep access through the end of your billing period.
Markets leave clues
Seven days, full access, no card. If the tape doesn't change how you watch the market, walk away.
Start your free 7-day trial →